Guidotti R., M. Stupazzini, C. Smerzini, R. Paolucci R. and P. Ramieri (2011), Numerical study on the role of basin geometry and kinematic seismic source in 3D ground motion simulation of the Mw 6.3 Lyttelton earthquake on February 21st, 2011, New Zealand, Seismoll Res. Lett., Volume 82, Number 6, pp. 767-782.
Mazzieri I., M.Stupazzini, R.Guidotti, C.Smerzini: SPEED: SPectral Elements in Elastodynamics with Discontinuous Galerkin: a non-conforming approach for 3D multi-scale problems, Int. J. Numer. Meth. Eng., (2013); 12: 991-1010.
A challenging case study
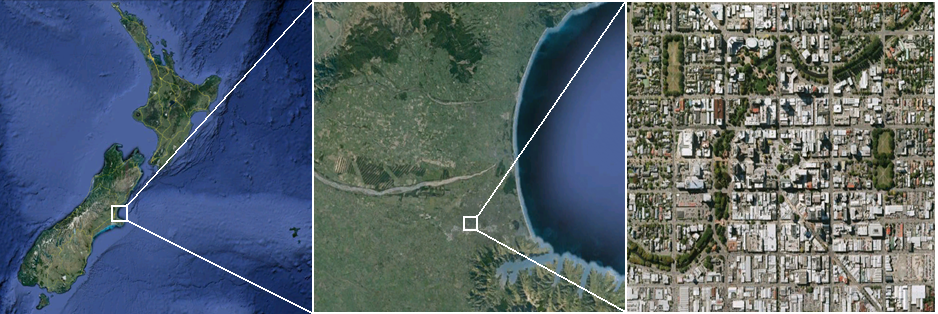
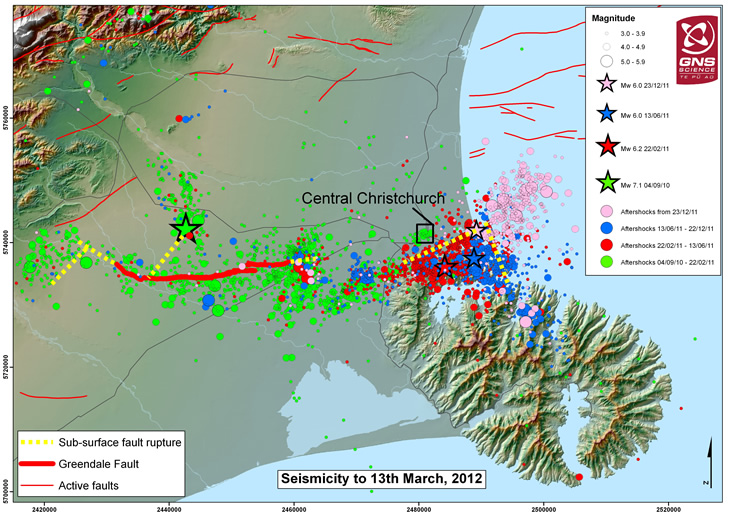
Between September 2010 and December 2011 the Canterbury Plains and, in particular, the city of Christchurch, in the South Island of New Zealand, experienced four major earthquakes with MW 6.0 and a huge number of aftershocks. The most damaging and deadliest of the seismic sequence, a MW 6.2 earthquake, happened on 22 February 2011, struck the city and the suburbs of Christchurch, causing extensive destruction and more than 180 victims.
From the geological data to the 3D model
Main features of the model are:
- Kinematic description of the close-by seismic source (New Zealand institute of Geological and Nuclear Science – GNS)
- Simplified but realistic description for the Cretaceous-Cenozoic alluvial Canterbury Plains
Canterbury Plains and kinematic source model
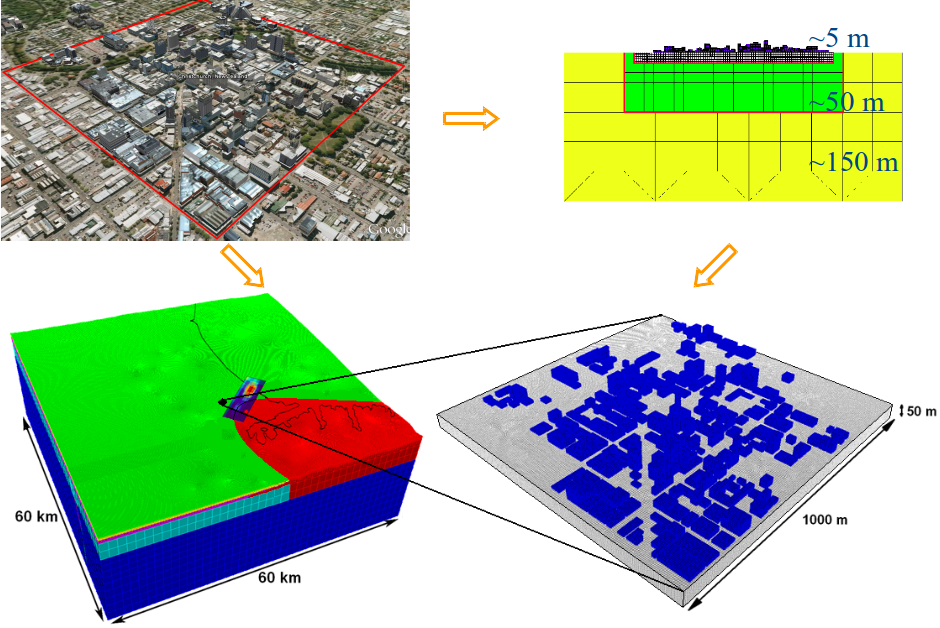
The numerical mesh of the Canterbury Plains has a global extension size 60 km x 60 km x 20 km and a number of around 500k hexahedral elements with maximum size, at bedrock, of around 1.500 m.
Computational geometry of the CBD
The computational domain integrates the numerical model of the Canterbury Plains with a realistic inventory of buildings, namely, a set of around 150 buildings within the CBD. As a starting point, the real configuration of the CBD has been considered, taking information on height and floor-plan dimensions of the buildings within an area having a dimension of about 1 km x 1 km. Also the foundations, for an average depth of 10 m, and the surrounding soil, for a depth of 50 m, have been taken into account. Assuming a mesh size of around 5 m, the CBD is described by a number of about 500k hexahedral elements.
Numerical Results
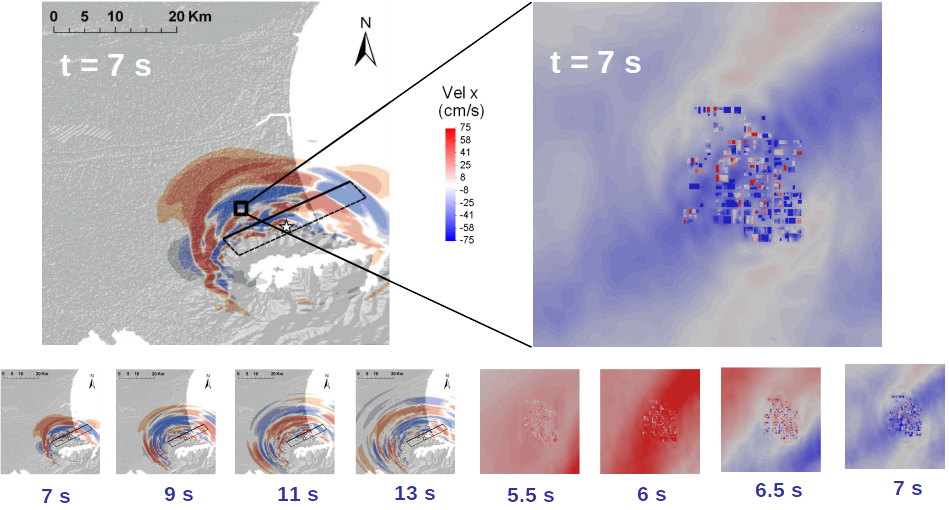
The complexity of the seismic wave propagation is fully considered at a Site-City scale, where the Central Business District (CBD) of Christchurch is geometrically represented and numerically modelled.
Snapshots of simulated velocity wavefield
Snapshots of the velocity wave-field and Peak Values maps show the active role played by the buildings cluster. A densely urbanized area influences and modifies the observed strong ground motion. This could explain the frequently reported damage variability in apparently homogeneous areas.
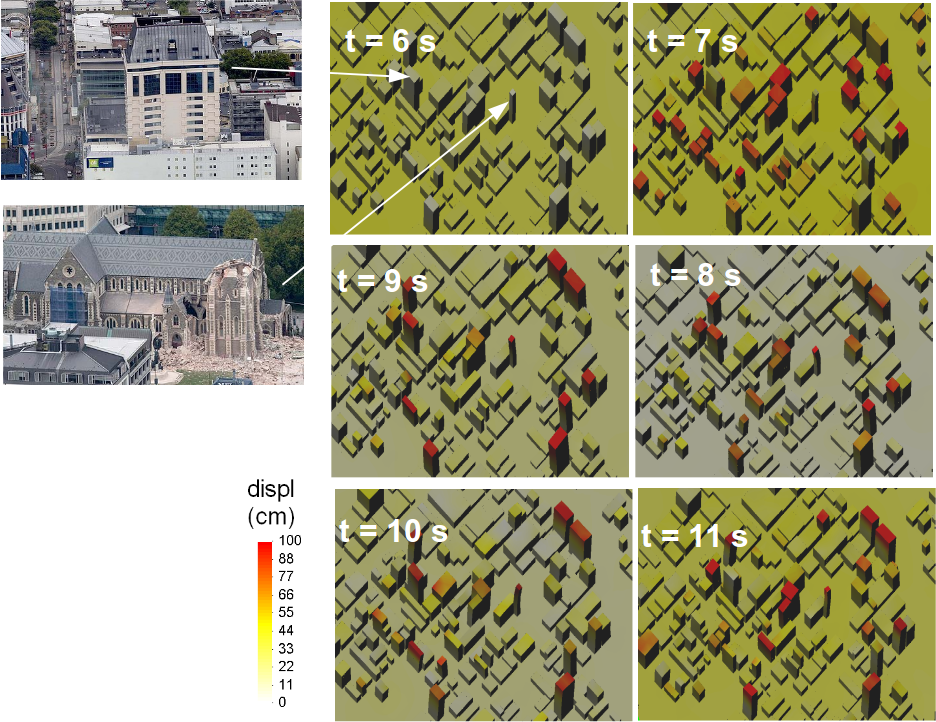
Snapshots of simulated displacement of the CBD
To shed light on the issues regarding Soil City Interaction (SCI) effects we report some snapshots of the simulated displacement wavefield, with particular reference to response of the CBD buildings. In this example, SCI turns out to produce scattering and focusing effects, increasing the ground motion variability within the CBD area, at a very small scale, and, hence, the consequent rotational motions at the base of the buildings themselves. Furthermore, these snapshots point out that pounding effects, related to the different vibration modes of the nearby buildings, are realistically reproduced by the numerical simulations.

