R. Paolucci, I. Mazzieri, and C. Smerzini (2015). Anatomy of strong ground motion: near-source records and three-dimensional physics-based numerical simulations of the Mw 6.0 2012 may 29 Po Plain earthquake, Italy. Geophysical Journal International, 203 (3): 2001-2020
Introduction
Between 2012 May and June, a sequence of earthquakes struck a densely populated area in the Po Plain, about 20 km north of Modena and west of Ferrara, in the Emilia-Romagna region, Northern Italy, causing 27 fatalities and substantial damage especially to industrial facilities and historical monuments. The sequence started with a Mw 6.1 event (source: Regional Centroid Moment Tensor (RCMT), http://www.bo.ingv.it/RCMT) on May 20, at 02:03:53 (UTC), with epicentre near the town of Finale Emilia. In the following days, the seismic sequence migrated Westwards and culminated, on May 29, at 07:00:03 (UTC), with a second relevant shock of Mw 6.0 (source: RCMT, http://www.bo.ingv.it/RCMT), about 10 km SW of the May 20 event, with epicentre close to the municipalities of Mirandola and Medolla.
The seismic sequence occurred in the Southern portion of the Po Plain, a subsident EW trending foreland basin of two opposite verging fold-and-thrust belts, the Southern Alps to the north and the Northern Apennines to the south, which developed in response to the collision of the African and European plates from the Cretaceous onward (Burrato et al. 2012).
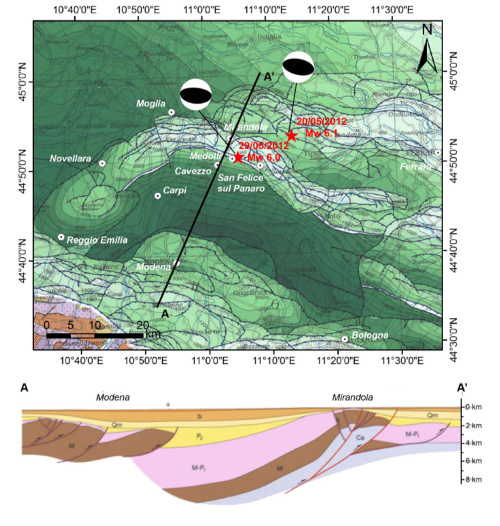
Top panel: structural map of Italy, reproduced from Bigi et al. (1992), where the different shades of green denote the depth of the base of Pliocene; the epicentres (stars) and focal mechanisms of the two main shocks of the Po Plain seismic sequence on 2012 May 20 (M W 6.1) and May 29 (M W 6.0) are also indicated. Focal mechanisms are from the time domain moment tensors (TDMT) database, http://cnt.rm.ingv.it/tdmt. Bottom panel: simplified geological cross-section A–A passing through the Ferrara-Romagna folded arc and showing the structural high close to the town of Mirandola (from Boccaletti et al. 2010). (a) Middle (0.45 My–Present); (b) Middle Pleistocene (1–0.45 My); Qm: Early Pleistocene (1.8–1 My); P 2 : Middle-Late Pliocene (4.1–1.8 My); M-P 1 : Late Messinian–Early Pliocene (6.3–4.1 My); M: Miocene (24–5.4 My); Ca: Meso-Cenozoic carbonatic succession (227–24 My).
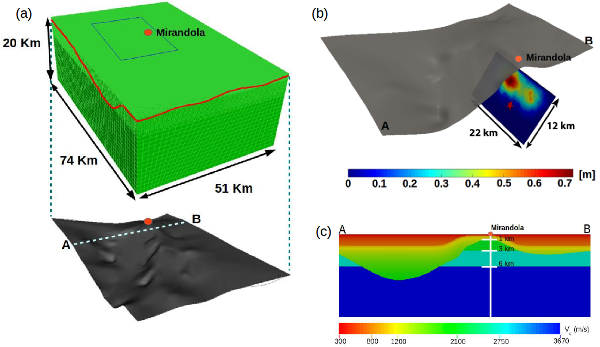
(a) 3D numerical model including the seismic fault responsible of the Mw 6.0 May 29 earthquake and the buried topography, corresponding to top of the Miocene formations. (b) Assumed slip distribution to model the earthquake fault rupture. (c) Representative NS cross-section of the numerical model passing through Mirandola, showing the Vs model adopted in the 3D numerical simulations for both Quaternary-Pliocene deposits and bedrock older formations.
Numerical Model
The computational domain adopted for the numerical simulation of the Mw 6.0 May 29 earthquake extends over a volume of about 74 km × 51 km × 20 km and is discretized using an unstructured conforming hexahedral mesh with characteristic element size ranging from ≈150 m at the surface to ≈1500 m at the bottom of the model. The mesh was created in order to propagate frequencies up to about 1.5 Hz. Compared to standard approaches based on plane wave propagation analyses through horizontally layered media, the distinctive features of the numerical model are:
- a kinematic representation for the seismic fault rupture of the 29 May earthquake
- inclusion of a 3D velocity model of the Po Plain, taking into account the spatial variation of the most relevant geological discontinuities beneath the surface sediments, which have significant effects on the seismic wave propagation. Due to the small topographic variations of the investigated area, a flat-free surface has been used.
Numerical Results
Map of permanent uplift
To assess the accuracy of the proposed fault model and the performance of the numerical simulations at very low frequencies, we address the comparison of the numerical results with the ground deformation maps produced starting from the aftermath of the May 20 main shock (Salvi et al. 2012; Pezzo et al. 2013), taking advantage of the Synthetic Aperture Radar Interferometry (InSAR) survey activated by the Italian Space Agency, with the coverage of all four Constellation of Small Satellites for the Mediterranean Basin Observation satellites (COSMO-SkyMed).
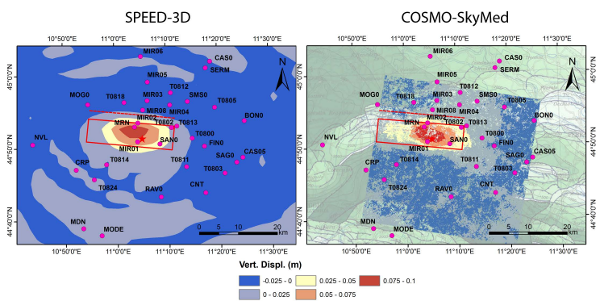
Map of permanent ground uplift simulated by SPEED (left) and observed by COSMO-SkyMed InSAR processing (right). In both maps the surface projection of the fault area is shown, together with the intersection of the fault plane with ground surface (dashed line).
Peak Ground Velocity Map
As a comparison between simulations and observations, we report the spatial distribution of PGV (gmh = geometric mean of horizontal components), as predicted by our physics-based 3D numerical simulations. For comparison, the observed gmh values of PGV, obtained at the available SM stations in the same frequency range of 3D numerical simulations, are depicted by filled dots.
Note that, to produce the map, both numerical results and records have been low-pass filtered at 1.5 Hz, for consistency with the spatial resolution of the numerical mesh. It is worth noting that the two-lobed pattern of gmh PGV turns out to be fairly consistent with the spatial distribution of macroseismic intensity, Imcs. Note that the Imcs map shows the combined effects of the entire seismic sequence from 2012 May 20 to June 3.
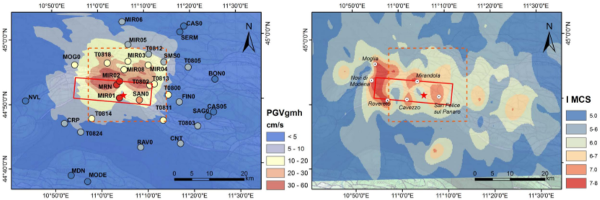
Left: spatial distribution of PGV (gmh = geometric mean of horizontal components) from physics-based 3D numerical simulations. The observed values of gmh PGV (see filled dots), obtained at the available SM stations, are also superimposed for comparison purposes. Right: Imcs map for the whole 2012 May and June seismic sequence. The superimposed box on both panels denotes the region that is mostly associated to the May 29 earthquake.
References
Bigi, G. et al., 1992. Structural Model of Italy 1:500,000, CNR Progetto Finalizzato Geodinamica.
Boccaletti, M., Corti, G. & Martelli, L., 2010. Recent and active tectonics of the external zone of the Northern Apennines (Italy), Int. J. Earth Sci.,
100, 1331–1348.
Burrato, P., Vannoli, P., Fracassi, U., Basili, R. & Valensise, G., 2012. Is blind faulting truly invisible? Tectonic-controlled drainage evolution in the epicentral area of the May 2012, Emilia-Romagna earthquake sequence (Northern Italy), Ann. Geophys., 55(4), doi:10.4401/ag-6182.