Paolucci, R., Mazzieri, I., Smerzini, C. & Stupazzini, M., (2014). Physics-based earthquake ground shaking scenarios in large urban areas, in Perspectives on European Earthquake Engineering and Seismology, Geotechnical, Geological and Earthquake Engineering, vol. 34, chap. 10, pp. 331–359, ed. Ansal, A., Springer.
Geological dataset
The Wellington Region sits on a major plate tectonic boundary and is crossed by several seismically active faults (Begg & Mazengarb, 1996; Van Dissen & Berryman, 1996; Begg et al. 2008). The relatively high earthquake hazard (Stirling et al. 2002) associated with the several active faults in the Wellington region and the concentrated urban population of the Lower Hutt valley combine to produce an area with a high seismic risk.
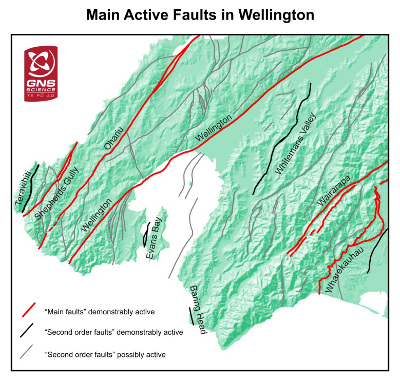
Main active faults in Wellington (source: GNS web site).
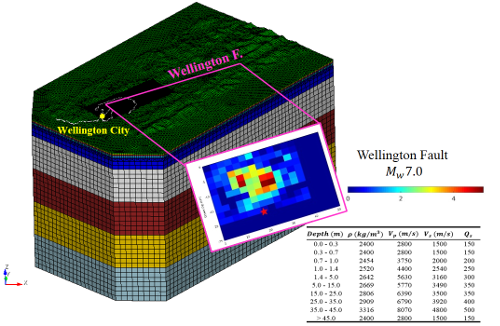
3D spectral element mesh for the broader Wellington area. The crustal model, the faults included in the model and the slip distribution are also shown.
Numerical Model
The numerical model covers an area of approximately 50 x 80 x 45 km and is composed by around 350k hexahedral elements. The 3D model has been created to propagate frequencies up to about 2.0 Hz. In yellow is represented the Wellington-Lower Hutt basin; superimposed are the coast-line and the Wellington fault line. In the model, it has been included the 3D shape of the Wellington-Lower Hutt basin (adapted from Benites et al., 2005) as well as a kinematic seismic source.
Numerical Results
Peak Ground Velocity Map
Interesting outputs of 3D numerical simulations are the ground shaking maps at a broad scale in terms of different ground motion intensity measures, such as Peak Ground Velocity (PGV). Here, the spatial distribution of PGV (filtered in the range 0.1-2 Hz) is shown for the three components of ground motion: normal to the fault strike (Fault Normal, FN), parallel to the fault strike (Fault Parallel, FP) and vertical (UP). For comparison purposes, the same color scale has been adopted for the three maps.
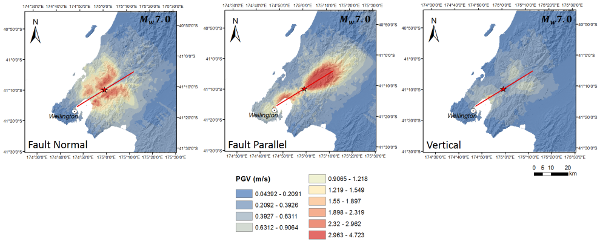
Map of Peak Ground Velocity (PGV) on the Fault Normal (FN), Fault Parallel (FP) and vertical (UP) component.
References
Begg, J.G., Mazengarb, C. 1996. Geology of the Wellington area, scale 1:50 000. Institute of Geological & Nuclear Sciences geological map 22. 1 sheet+128p. Lower Hutt, New Zealand: Institute of Geological & Nuclear Sciences Limited.
Van Dissen, R.J., Berryman, K.R. 1996. Surface rupture earthquakes over the last c. 1000 years in the Wellington region, New Zealand, and implications for ground shaking hazard. Journal of Geophysical Research 101(B3): 5999-6019.
Begg, J., Langridge, R., Van Dissen, R., Little, T. 2008. Field Trip 1 – Wellington Fault: neotectonics and earthquake geology of the Wellington-Hutt Valley segment. Geological Society of New Zealand Miscellaneous Publication 124B. Geosciences ’08 – Geological Society of New Zealand, New Zealand Geophysical Society, New Zealand Geochemical & Mineralogical Society joint annual conference field trip guide, 23 Nov., 2008, Wellington, New Zealand: p. 5-67
Stirling, M.W., McVerry, G.H., Berryman, K.R. 2002. A new seismic hazard model for New Zealand. Bulletin of the Seismological Society of America, 92(5): 1878-1903.
Benites, R., Olsen, K.B., 2005. Modeling Strong Ground Motion in the Wellington Metropolitan Area, New Zealand. Bulletin of the Seismological Society of America, 95(6): 2180–2196.